I propose the following project. I would like to do a project with analysis on crime data. This may have an impact on society in terms of prevention and rehabilitation and could save lives.
The Texas Department of Criminal Justice has a nice website full of information. Within the site I came across their data about death row. I further focused in on those that were actually executed. The webpage provides detailed information on the ‘Executed Offenders’ and links to even more information for each. Included in this is a link next to each name to their Last Statement.
I thought it would be interesting and insightful to analyze ages of those that were executed, the word frequency of their last statements and the connection between the two.
I used Python to process the data and Processing(Processing is an open source programming language and IDE) to visualize the data.
I wrote python code to gather the Executed offender information from the list of executed offenders and go into each Last Statement link and gather their last statement.
See for example: Vasquez and Ward.
Here is the python code I wrote to do this. My program also outputs a file with ages and their frequencies as well as a file with words from their last statements and their frequencies.
import re
import urllib
from BeautifulSoup import *

url = 'http://www.tdcj.state.tx.us/death_row/dr_executed_offenders.html'

def name(url):
    x = url.split('_')
    y = x[2].split(".")
    return y[0]

def filter(statement,replaceWhat, replaceWith):
    statementTemp = statement.split(replaceWhat)
    statement     = ' '
    for state in statementTemp:
        statement+=(state+replaceWith)
    return statement[:-1]

print name(url)
html = urllib.urlopen(url).read()
{x= re.findall(r'<td.*?>(.+)</pre>',html) }
length  = len(x)
#length = 30
counts  = dict()

ageFreq = []
for i in xrange(100):
    ageFreq.append(0)

for l in xrange(length):
    if l%10==2:
        y         = x[l].split('"')
        x[l]      = 'http://www.tdcj.state.tx.us/death_row/'+y[1]
        html2     = urllib.urlopen(x[l]).read()
        soup      = BeautifulSoup(html2)
        tags      = soup('p')
        statement = ' '
        for tag in tags[6:]:
             statement += (' '+str(tag))
        x2        = re.findall(r'(.+?)',statement)
        statement = ' '
        for p in x2:
            statement+=(p+' ')
        statementTemp = statement.split('’')

        statement=filter(statement, "’" , "")
        statement=filter(statement, "'" , "")
        statement=filter(statement, "." , " ")
        statement=filter(statement, "," , " ")
        statement=filter(statement, ":" , " ")
        statement=filter(statement, ";" , " ")
        statement=filter(statement, "?" , " ?")
        statement=filter(statement, "!" , " !")
        statement=filter(statement, "(" , " ")
        statement=filter(statement, ")" , " ")
        statement=filter(statement, "[" , " ")
        statement=filter(statement, "]" , " ")
        statement=filter(statement, "/" , " ")
        statement=filter(statement, """ , " ")

        x[l]       = statement.lower()
        statement2 = x[l].split()
        for word in statement2:
            counts[word] = counts.get(word,0)+1
    if l%10==6:
        #print int(x[l])
        ageFreq[int(x[l])]+=1

#print counts
for w in sorted(counts, key=counts.get, reverse=True):
    print w, counts[w]

print '\n\n',ageFreq

wordTotal=0
handle = open('wordFreq.txt','w')
#for word,count in counts.items():
#    handle.write(word+" "+str(count)+'\n')
for w in sorted(counts, key=counts.get, reverse=True):
    handle.write(w+" "+str(counts[w])+'\n')
    wordTotal+=counts[w]
print "There were a total of",wordTotal,"words"

temp=[]
for i in xrange(len(ageFreq)):
    if(ageFreq[i]==0):
        continue
    temp.append(i)
ageFreq2= ageFreq[temp[0]:temp[-1]]

handle2 = open('ageFreq.txt','w')
for i in xrange(temp[-1]-temp[0]+1):
    handle2.write(str(i+temp[0])+": "+str(ageFreq[i+temp[0]])+'\n')
My program also attempts to combine any duplicate words that may have been typed differently. (For example the words y’all ya’ll and yall each had their own count in one of my earlier versions of code so I eliminated all apostrophes and they all were included in the same frequency count for ‘yall’)
I took a look at the words and selected the most common Non-Trivial words. (For example: the word “I” was most common at 3,264 times out of 45,633 total words is all the statements. However, I considered this a trivial word for the current analysis.
I then drew my results in a visualization.
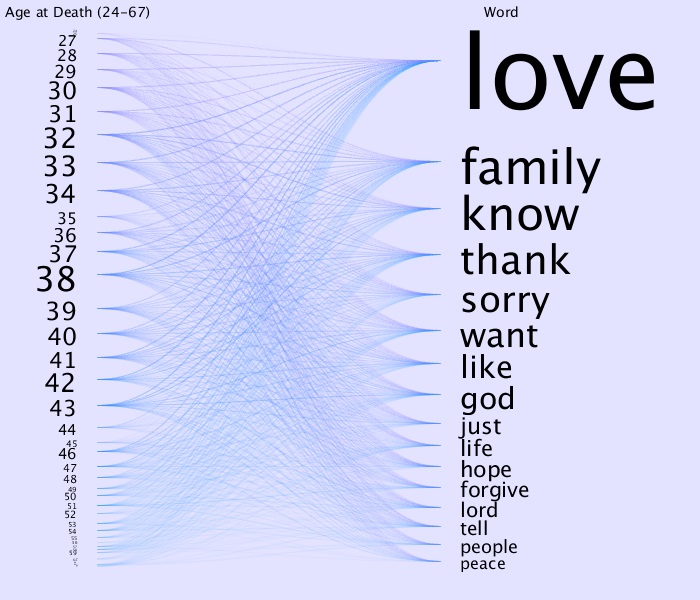
On the left of my visualization I have the various ages ranging from top to bottom, youngest to oldest, 24-67. The ages have their text size based on the frequency of the offenders at that age. The right side lists the 16 most common non-trivial words. Here too, text size is based on relative frequency of those words.
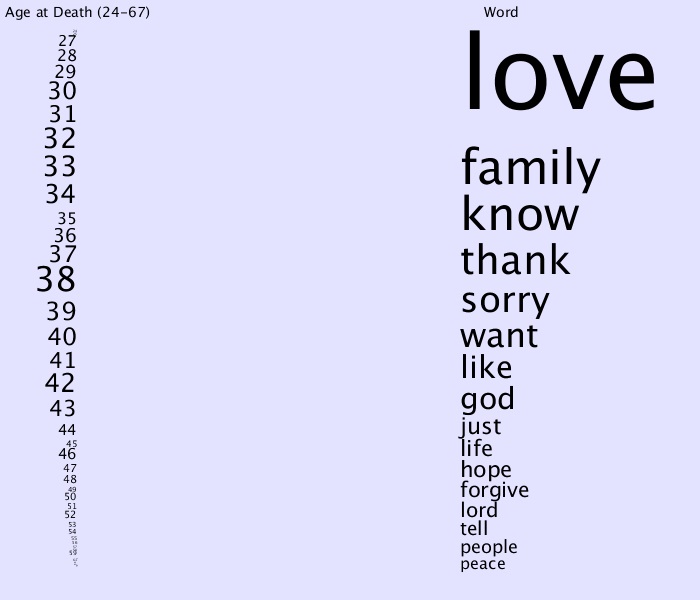
I then wrote the following python code to go through each person and output their age as well as whether or not they said the words we are focusing on.
import re
import urllib
from BeautifulSoup import *
url = 'http://www.tdcj.state.tx.us/death_row/dr_executed_offenders.html'
grid = open('grid.txt','w')
mostCommon1 = ['love','family','know','thank','sorry','want','like','god']
mostCommon2 = ['just','life','hope','forgive','lord','tell','people','peace']
mostCommon = mostCommon1+mostCommon2
print mostCommon
def filter(statement,replaceWhat, replaceWith):
statementTemp = statement.split(replaceWhat)
statement=' '
for state in statementTemp:
statement+=(state+replaceWith)
return statement[:-1]
html = urllib.urlopen(url).read()
x = re.findall(r'<td.*?>(.+)</pre>',html)
length = len(x)
#length = 30
for l in xrange(length):
if l%10==2:
y = x[l].split('"')
x[l] = 'http://www.tdcj.state.tx.us/death_row/'+y[1]
html2 = urllib.urlopen(x[l]).read()
soup = BeautifulSoup(html2)
tags = soup('p') statement=' '
for tag in tags[6:]:
statement+=(' '+str(tag))
x2 = re.findall(r'(.+?)',statement)
statement = ' '
for p in x2:
statement+=(p+' ')
statementTemp = statement.split('’') statement=filter(statement, "&rsquo" , "")
statement=filter(statement, "'" , "") statement=filter(statement, "." , " ")
statement=filter(statement, "," , " ") statement=filter(statement, ":" , " ")
statement=filter(statement, ";" , " ") statement=filter(statement, "?" , " ?")
statement=filter(statement, "!" , " !") statement=filter(statement, "(" , " ")
statement=filter(statement, ")" , " ") statement=filter(statement, "[" , " ")
statement=filter(statement, "]" , " ") statement=filter(statement, "/" , " ")
statement=filter(statement, """ , " ")
x[l]=statement.lower()
statement2 = x[l].split()
gridLine=""
for word in mostCommon:
if word in statement2:
gridLine+=str(1)+','
else:
gridLine+=str(0)+','
gridLine=','+gridLine[:-1]
if l%10==6:
grid.write(x[l])
#print(gridLine)
grid.write(gridLine+'\n')
I then took that information and for each person and drew a line from their age to each word they spoke.
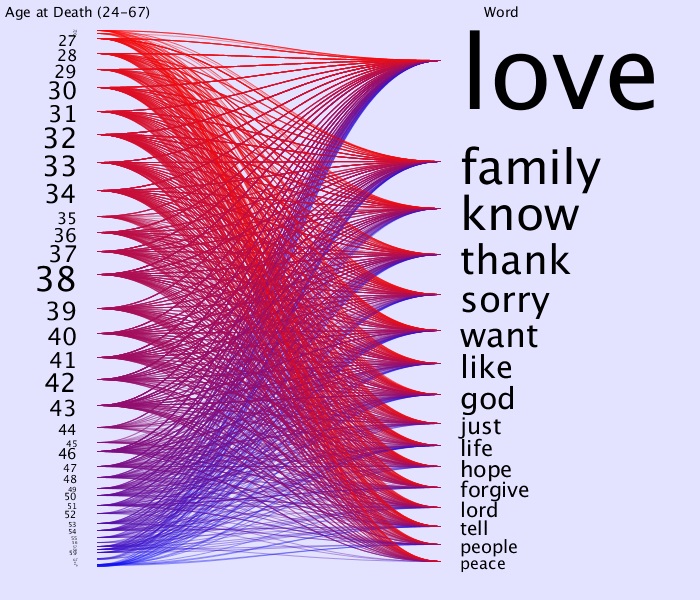
Interesting, it looks pretty even across the board. So it would seem that at least for the most part, these words are common for all age groups.
Let’s color based on approximately equal age groupings
I’ll make the age (inclusive) ranges 24-33, 34-44, 45-55, 56-67 to be red, green, blue and black respectively.
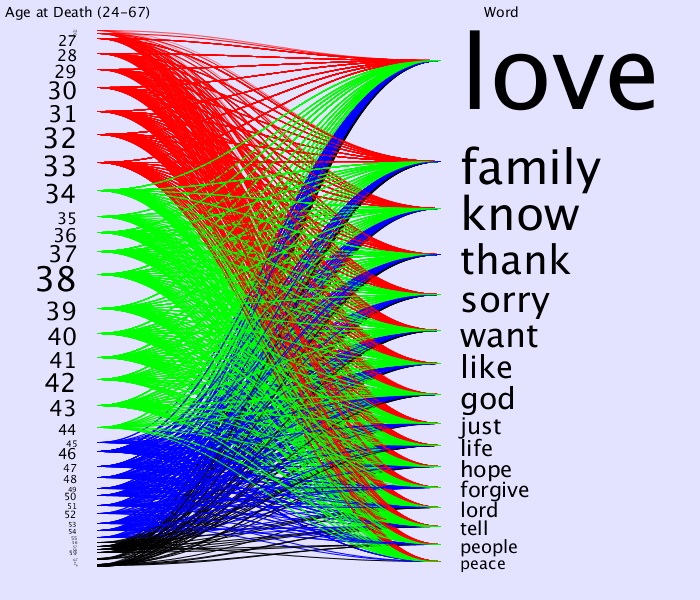
It still seems that every age group seems to say each of these words.
We can learn from this graphic, however, since there is more green than red than blue than black that this would be the hierarchy of the age group quantities of offenders.
A quick sum confirms this visual result since the age ranges, frequency and colors are
24-33 ; 160 ; Red
34-44 ; 226 ; Green
45-55 ; 91 ; Blue
56-67 ; 20 ; Black
There can be many color alterations that may give us some additional insight so I am adding some interaction to my graphic.
The A-S-D-F keys will increase the red-green-blue-opacity values while
The Z-X-C-V keys will decrease the red-green-blue-opacity values.
The Space-Bar will reset everything.
In this discussion, all visualizations are static images. To experience the interactivity click here
Here are some examples that come about:
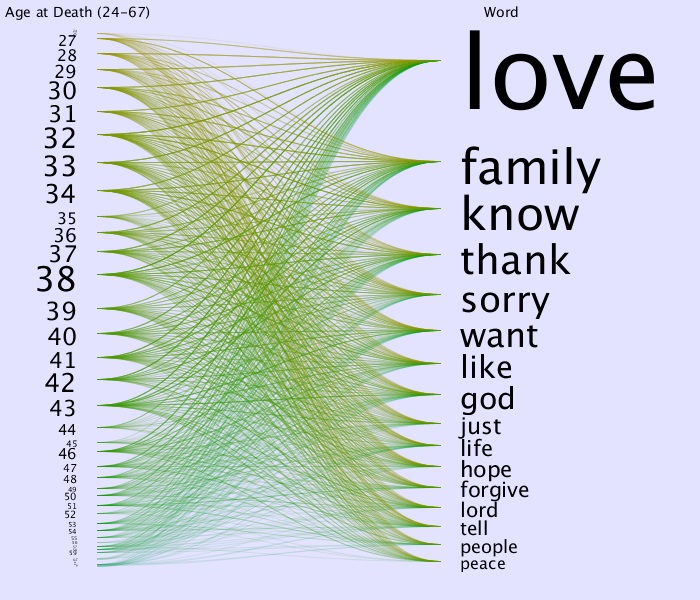
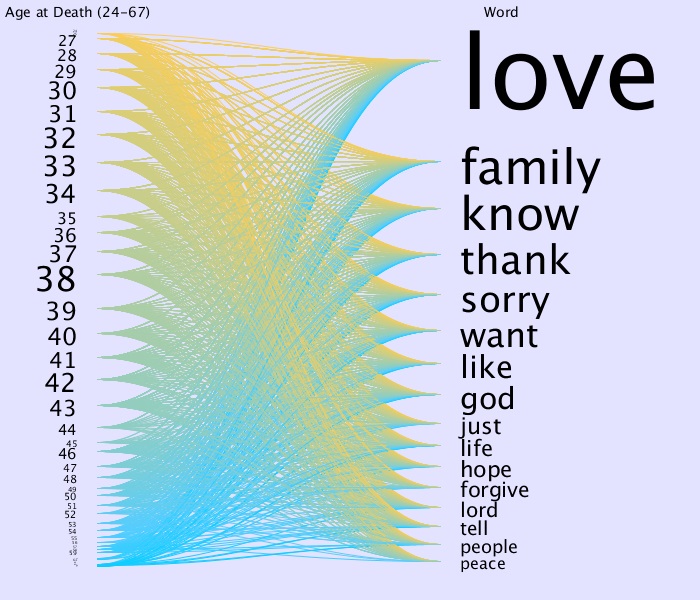
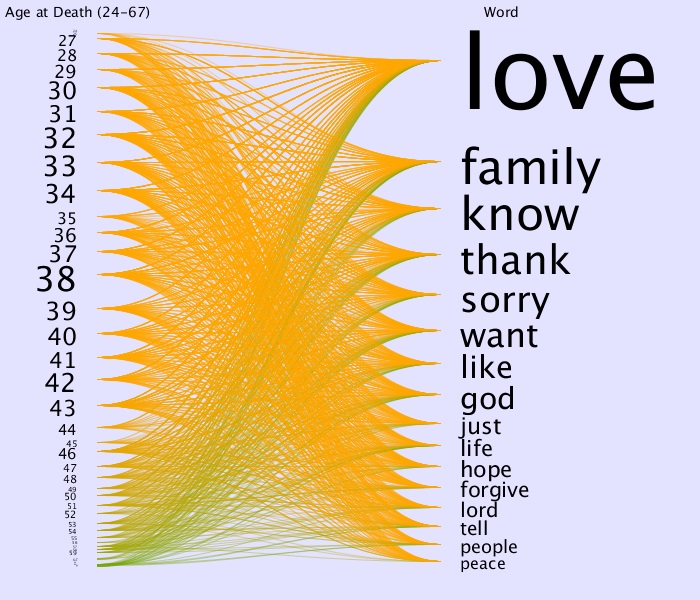
From this last one it sure looks like the green/higher ages are going
up rather than across.
Let’s Switch the colors to HSB mode (Hue Saturation Brightness)
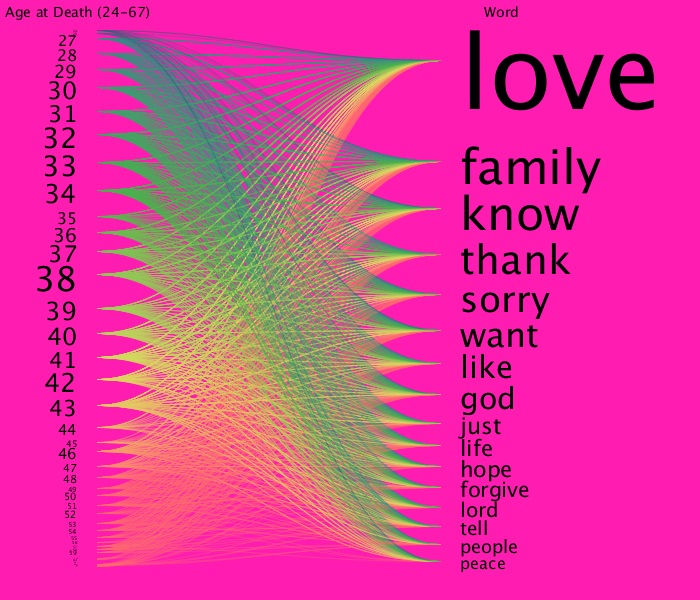
Let’s play with the colors again to see if we can see something
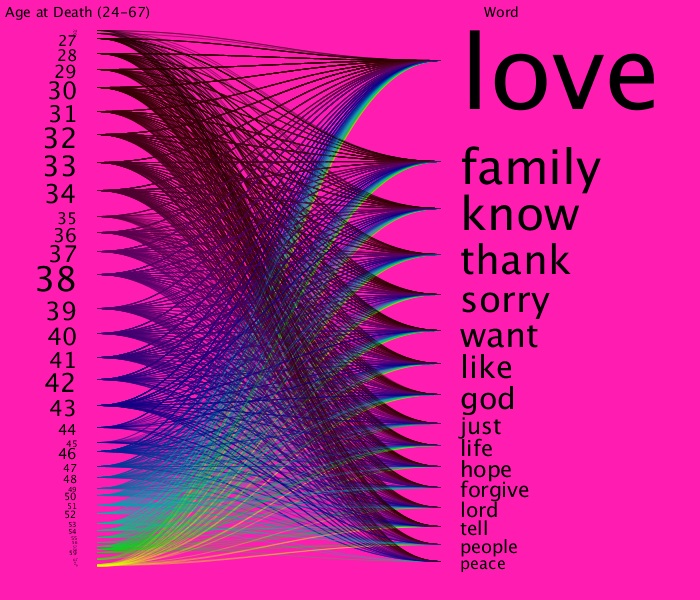
Hmm, the light blue on the bottom next to each word is coming from
the 50-57 range but on the words ‘god’ and ‘life’ seem much brighter blue than ‘just’ and ‘hope’ maybe even ‘forgive’ and for sure ‘peace.’
I think we should look at the ages individually.
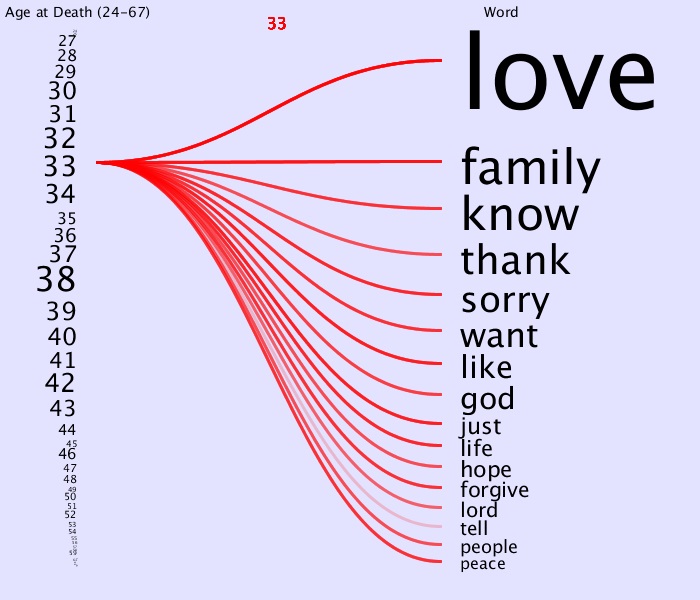
I built this functionality into my visualization as follows. The UP-Down arrows move to Higher-Lower ages viewing one age at a time. The Space-Bar will reset everything. The connections are drawn with medium opacity so that a higher quantity of people in that age range saying a specific word will result in a darker line from that age to that line.
In this discussion, all visualizations are static images. To experience the interactivity click here
For example, in the following view of 33 year old’s word frequencies, the word ‘tell’ was said less often than the other words:
Now earlier it seemed like from 50-57 the words ‘just,’ ‘hope,’ ‘forgive’ and ‘peace’ were left out more often than other ranges. Looking at each age individually,
for example:
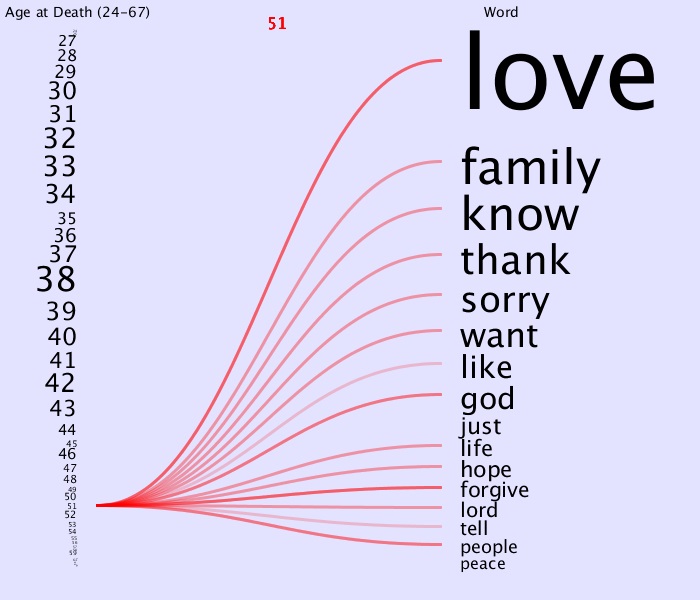
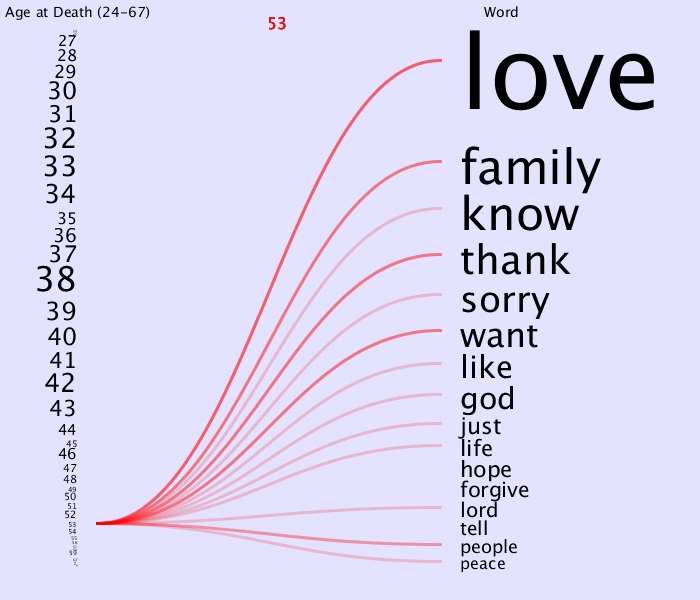
we find that of the 8 ages, ‘just’ and ‘peace’ were left out 5 times and ‘hope’ and ‘forgive’ were left out completely 4 and 3 times respectively. ‘forgive’ however was mainly light colored and thus even when it was there is was not stated by many. Note that ‘people’ and ‘tell’ were also left out completely 4 of the 8 ages.
It seems that in general, at the higher ages they are less likely to use the lower words but then again, there are fewer people.
Let’s try to additionally look at this from another angle.
But first, after adding in all the interaction, here is my processing code for this visualization.
String[] ageFreqA;
String[][] ageFreqB;
int[][]    ageFreqC;
int        border = 30;
int        ageFreqMax=0,ageFreqMin=0;
float      ageX[],ageY[];
color[]    ageColor;
int        c = 0, cOpacity=100, cOpacity2=0,cSW=1;
boolean    colorFlag=true;
float      r,g,b;
boolean    extraNumber = false;

String[]    selectwordFreqA;
String[][]  selectwordFreqB;
String[]    selectwordFreqCtext;
int[]       selectwordFreqCnum;
int         selectwordFreqMax=0,selectwordFreqMin=0;
float       wordX[],wordY[];

String[]    gridA;
int         gLen;

void setup () {
ageFreqA = loadStrings("...ageFreq.txt");
ageFreqB = new String [ageFreqA.length][2];
ageFreqC = new int[ageFreqA.length][2];
ageX     = new float[ageFreqA.length];ageY = new float[ageFreqA.length];

for(int i=0;i<ageFreqA.length;i++)
{ ageFreqB[i]    = split(ageFreqA[i],": ");
  ageFreqC[i][0] = int(ageFreqB[i][0]);
  ageFreqC[i][1] = int(ageFreqB[i][1]);
  if (ageFreqC[i][1]>ageFreqMax)
  {  ageFreqMax=ageFreqC[i][1];
  }
}
//printArray(ageFreqC[0]);

ageFreqMin=ageFreqMax;
for(int i=0;i<ageFreqA.length;i++)
{  if (ageFreqC[i][1]selectwordFreqMax)
    {    selectwordFreqMax=selectwordFreqCnum[i];
    }
}

selectwordFreqMin=selectwordFreqMax;
for(int i=0;i
The following computation and visualization was done in Processing.
In order to look at the relative frequencies of these words I took a tally of each word for each age. I then divided them by the total number of offenders at that age.
Using these new values I drew my next visualization as follows. I display the ages of executed offenders on the y-axis and the most common non-trivial words from the offenders’ last statements on the x-axis. Their intersection is then color coded based on the proportion of the frequency at that age to the number of offenders at the age. Darker is a higher and lower is less.
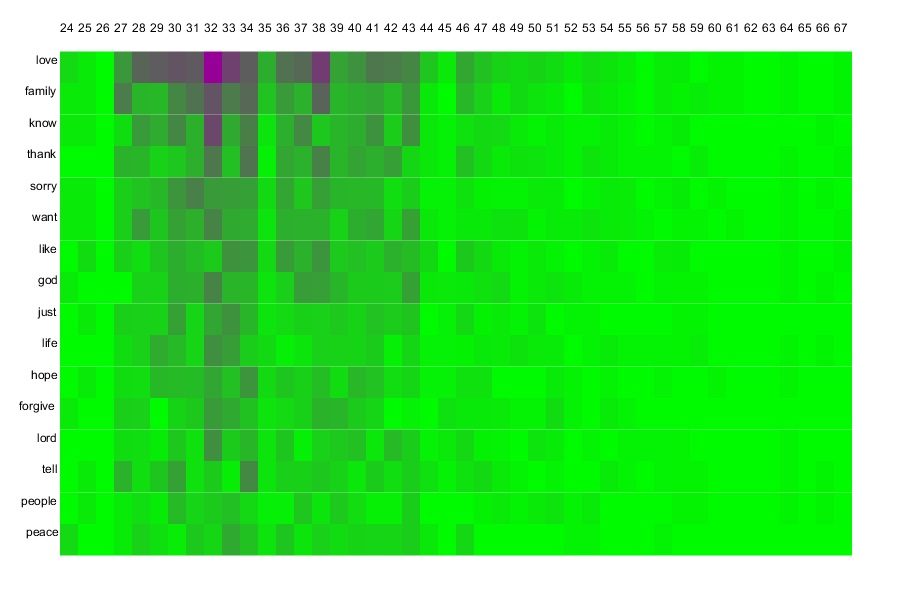
In the previous graphic the age range of 50-57 was brought to the forefront for its focus on the more frequent words. And that seems the same from this graphic where in this range the higher area is somewhat darker. But here we see something far more interesting: groupings in which ages seem to be (1) very light, (2)medium brightness (this includes the 50-57 range) and (3) dark.
Each group's last statements should probably be analyzed separately. Words of those that are lighter don't have these words all that often and thus this analysis should be redone to focus on those age groupings alone.
Focusing in on the offenders in the age range 27-43, for individuals in this range it is more likely that they used these words in their final statements. We can also see that ‘love’ is especially important to offenders in this range. Perhaps when trying to prevent criminal activity among 27-43 year olds, we should focus on the likely impact on loved ones.
For 32 year olds, their priorities are more spread out over all the words we analyzed. In particular “love, family, know, thank, want, god, life and Lord”. It would seem that when trying to prevent criminal activity among those around 32 years of age, we should not only focus on the impact on loved ones but focus on their wants, our appreciation of them and on their faith.
Here is the Processing code for this last visualization
String[] ageFreqA;
String[][]  ageFreqB;
int[][]     ageFreqC;

String[]    selectwordFreqA;
String[][]  selectwordFreqB;
String[]    selectword;

String[]    gridA;
String[][]  gridB;
float[][]   grid;

float[][]   master;
float       max=0.0;


void setup () {
//Pull in age frequency array
ageFreqA=loadStrings("C:/Users/jyarmish/Desktop/New Files Only/The Data Incubator Application/Challenge/Problem3/ageFreq.txt");
ageFreqB = new String [ageFreqA.length][2];
ageFreqC = new int[ageFreqA.length][2];

for(int i=0;i<ageFreqA.length;i++)
  {ageFreqB[i]=split(ageFreqA[i],": ");
   ageFreqC[i][0]=int(ageFreqB[i][0]);
   ageFreqC[i][1]=int(ageFreqB[i][1]);
  }
ageFreqA=null;
ageFreqB=null;

//dArrayprint(ageFreqC);


//Pull in select word list
selectwordFreqA=loadStrings("C:/Users/jyarmish/Desktop/New Files Only/The Data Incubator Application/Challenge/Problem3/selectwordFreq.txt");
int wLen=selectwordFreqA.length;
selectwordFreqB = new String [wLen][2];
selectword = new String[wLen];

for(int i=0;i<wLen;i++)
  {selectwordFreqB[i]=split(selectwordFreqA[i]," ");
   selectword[i]=selectwordFreqB[i][0];
  }

selectwordFreqA=null;
selectwordFreqB=null;

//for(int i=0;i<selectword.length;i++)
//    print(selectword[i]+", ");

//Pull in Grid.txt
gridA=loadStrings("C:/Users/jyarmish/Desktop/New Files Only/The Data Incubator Application/Challenge/Problem3/grid.txt");
int gLen=gridA.length;
gridB = new String[gLen][wLen+1];
grid  = new float[gLen][wLen+1];

//ageFreqB = new String [gLen][2];
//ageFreqC = new int[gLen][2];


for(int i=0;i<gLen;i++)
  {gridB[i]=split(gridA[i],',');
   //grid[i][0]=int(ageFreqB[i][0]);
   //gridC[i][1]=int(ageFreqB[i][1]);
  }

for(int i=0;i<gridB.length;i++)
    for(int j=0;j<gridB[0].length;j++)
           grid[i][j]=float(gridB[i][j]);

gridA=null;
gridB=null;

//dArrayprint(grid);

//Create Master Array
int m1=ageFreqC.length;
int m2=grid[0].length;
master = new float[m1][m2];
for(int i=0;i<m1;i++)
   for(int j=0;j<m2;j++)
   {master[i][0]=float(ageFreqC[i][0]);
   }

for(int i=0;i<grid.length;i++)//max){max=master[i][j];}
   }

//dArrayprint(master);
println (max);

size(900,600);
smooth();
}

void draw(){
noLoop();
background(255);
print(master.length,master[0].length);
int b1=60,b2=20;
float c,d;
float w = ((width)/master.length) *.9;
float h = ((height)/master[0].length) *.9;
for(int i=0;i<master.length;i++)//